
Welcome !
If you’ve landed here, chances are you came from my LinkedIn. This is a quick recap of a fun little solo project I did to explore the most in-demand skills in the Data & AI job market in France, as of May 2025.
It was a simple end-to-end (E2E) project, meaning I did everything myself: from gathering the data to exploring it and building the visualizations.
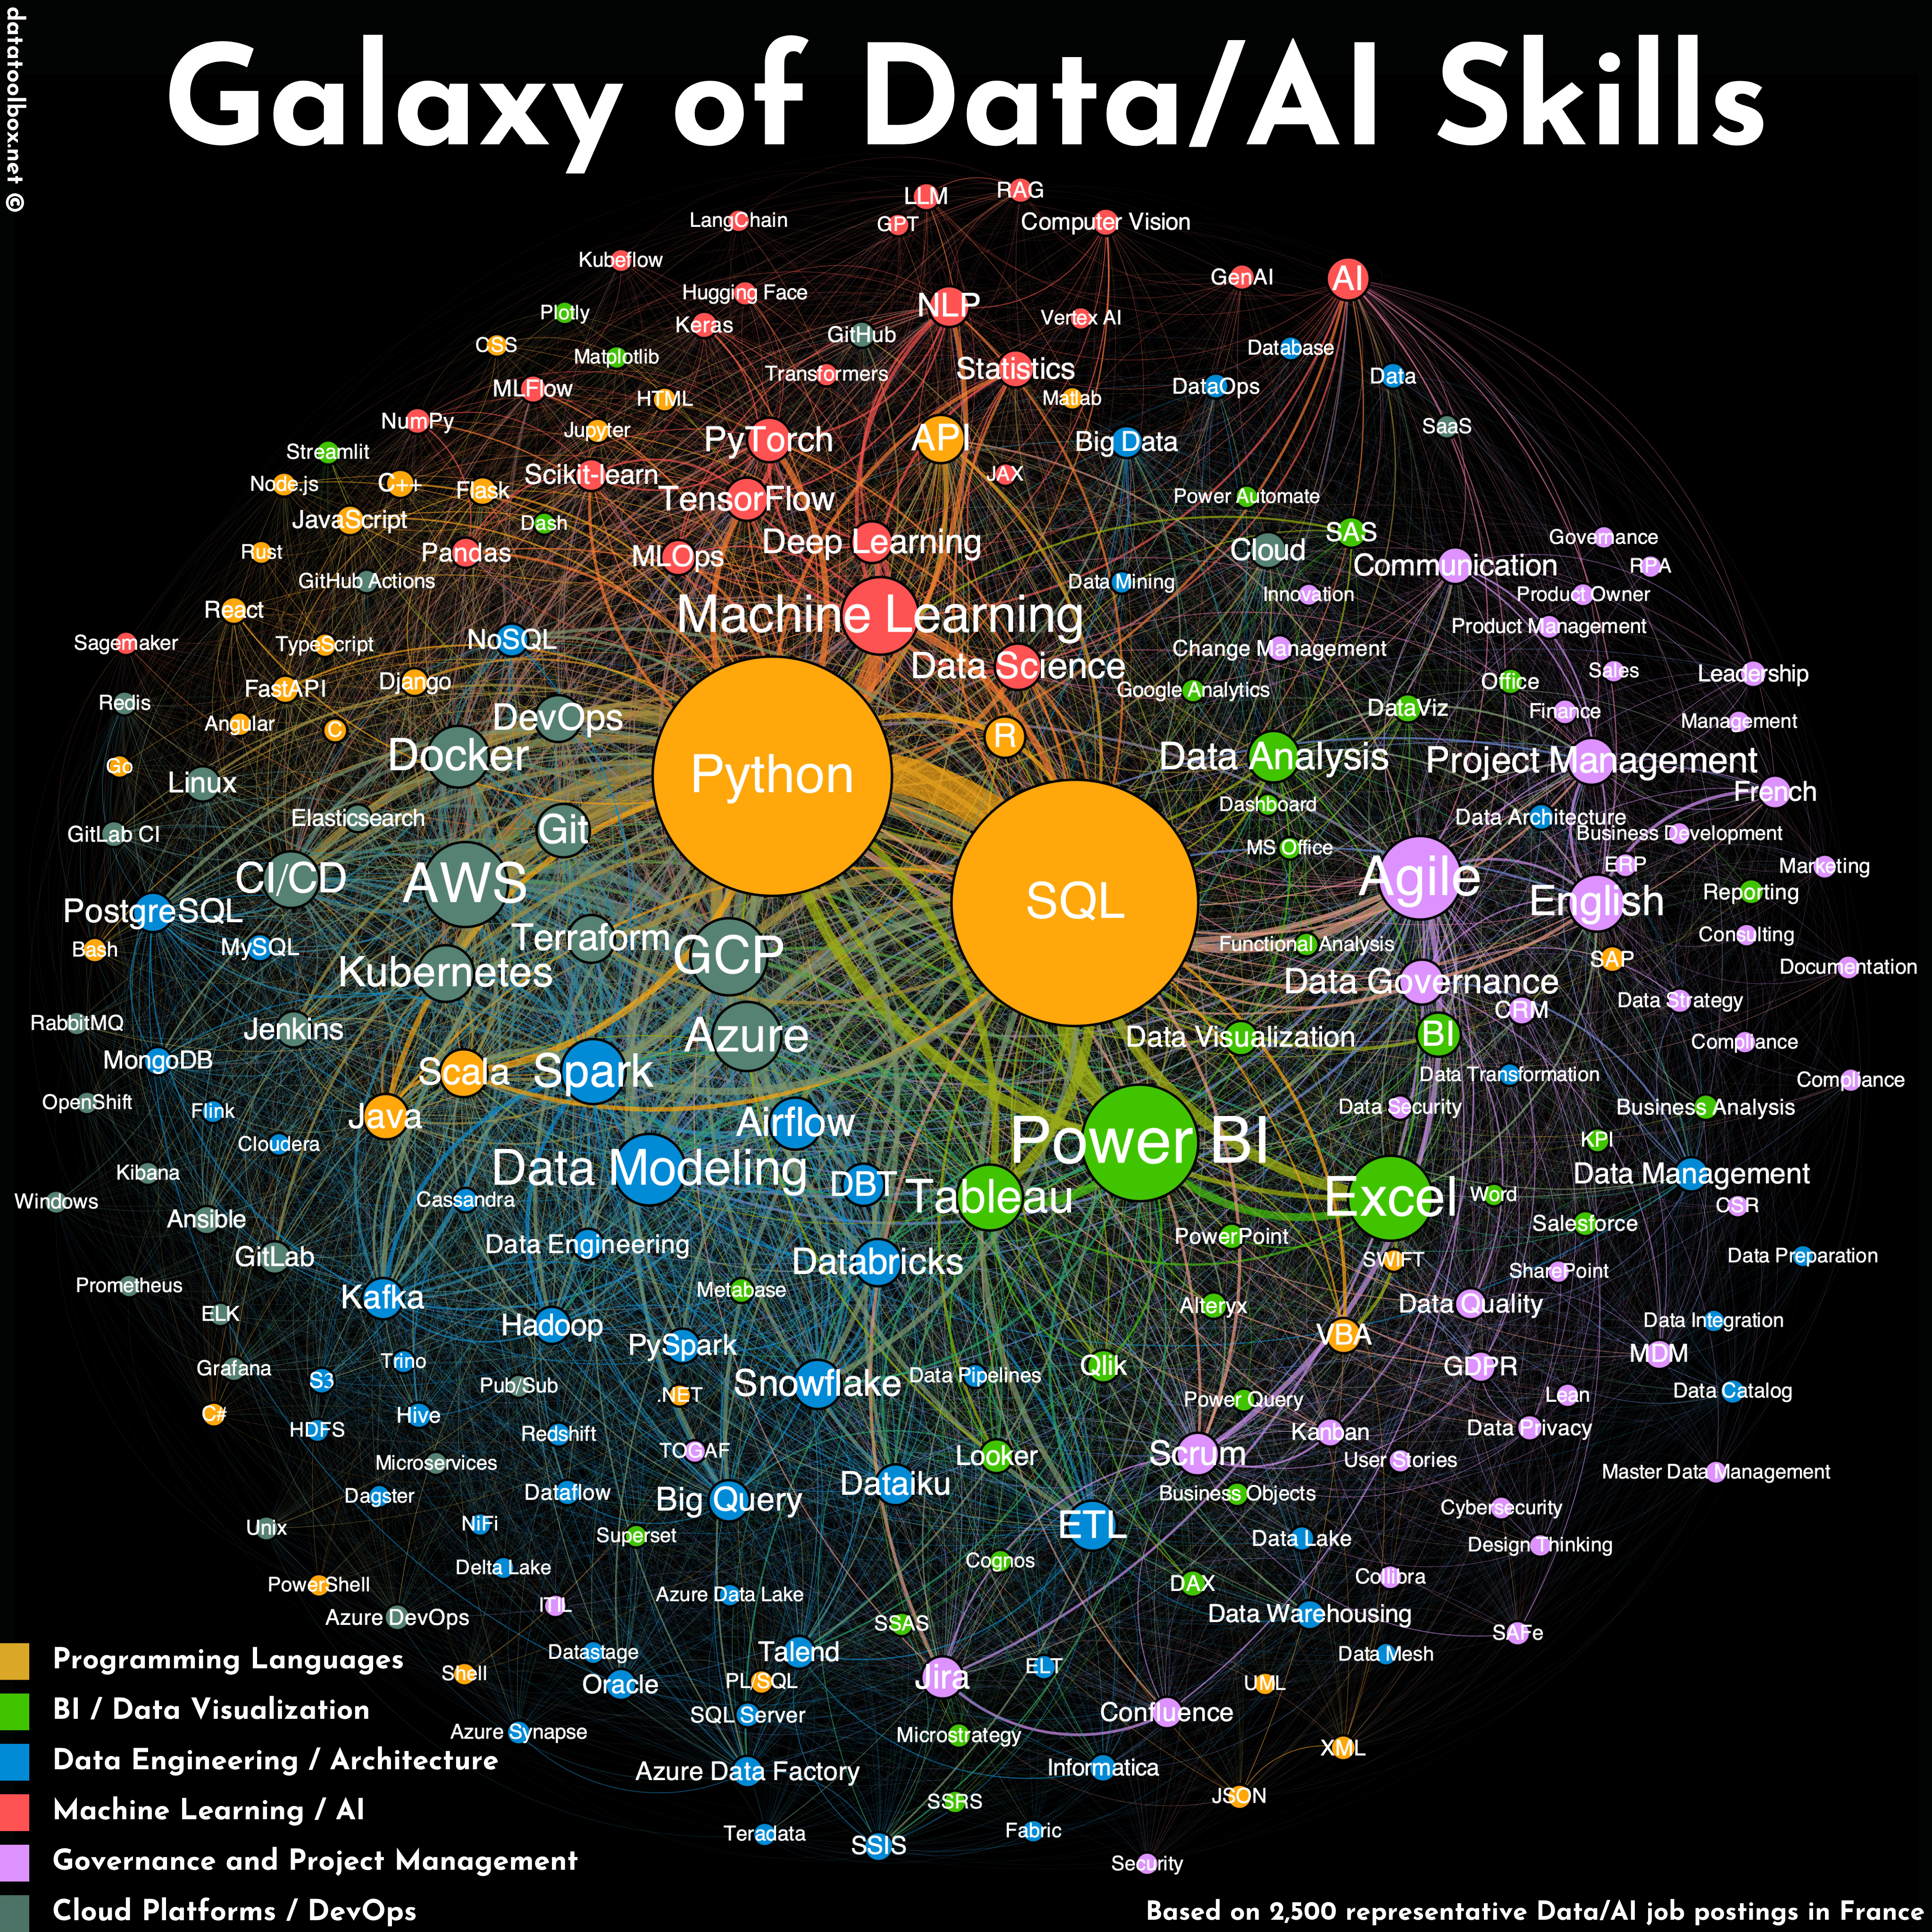
🌌 Explore in 4K the Full Galaxy
👉 Click here to view the full-width Galaxy of Data/AI Skills
The idea
Turn the chaos of job listings into a clear, visual map of the Data & AI landscape :
- Scrape 2,500 job postings using keywords like “data”, “AI”, “ML”, “Power BI”, etc.
- Feed it all to a well-prompted LLM to turn messy job descriptions into clean structured data.
- Visualize the results as a galaxy of skills, where connections and gravity fields emerge naturally.
Quick explanation of the result
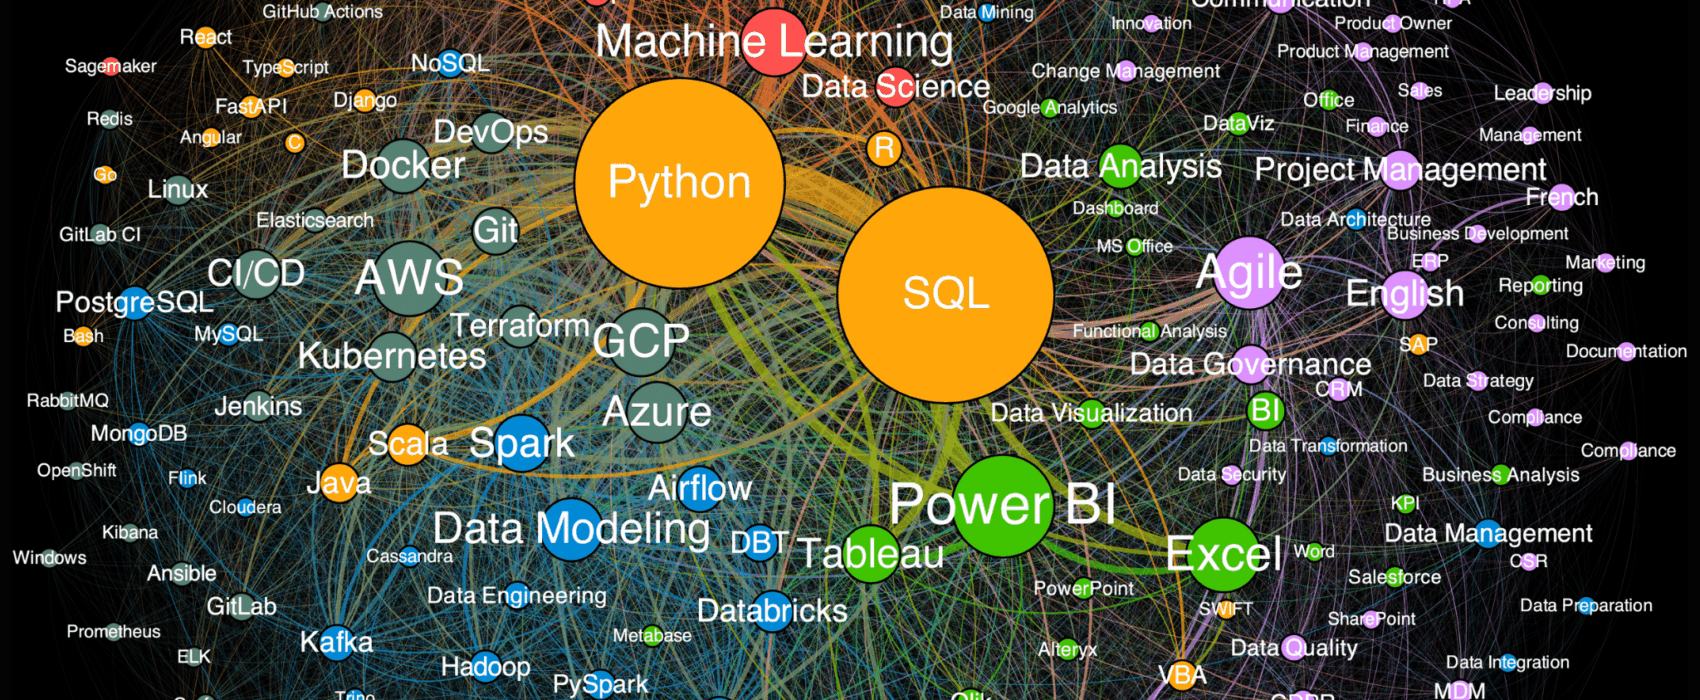
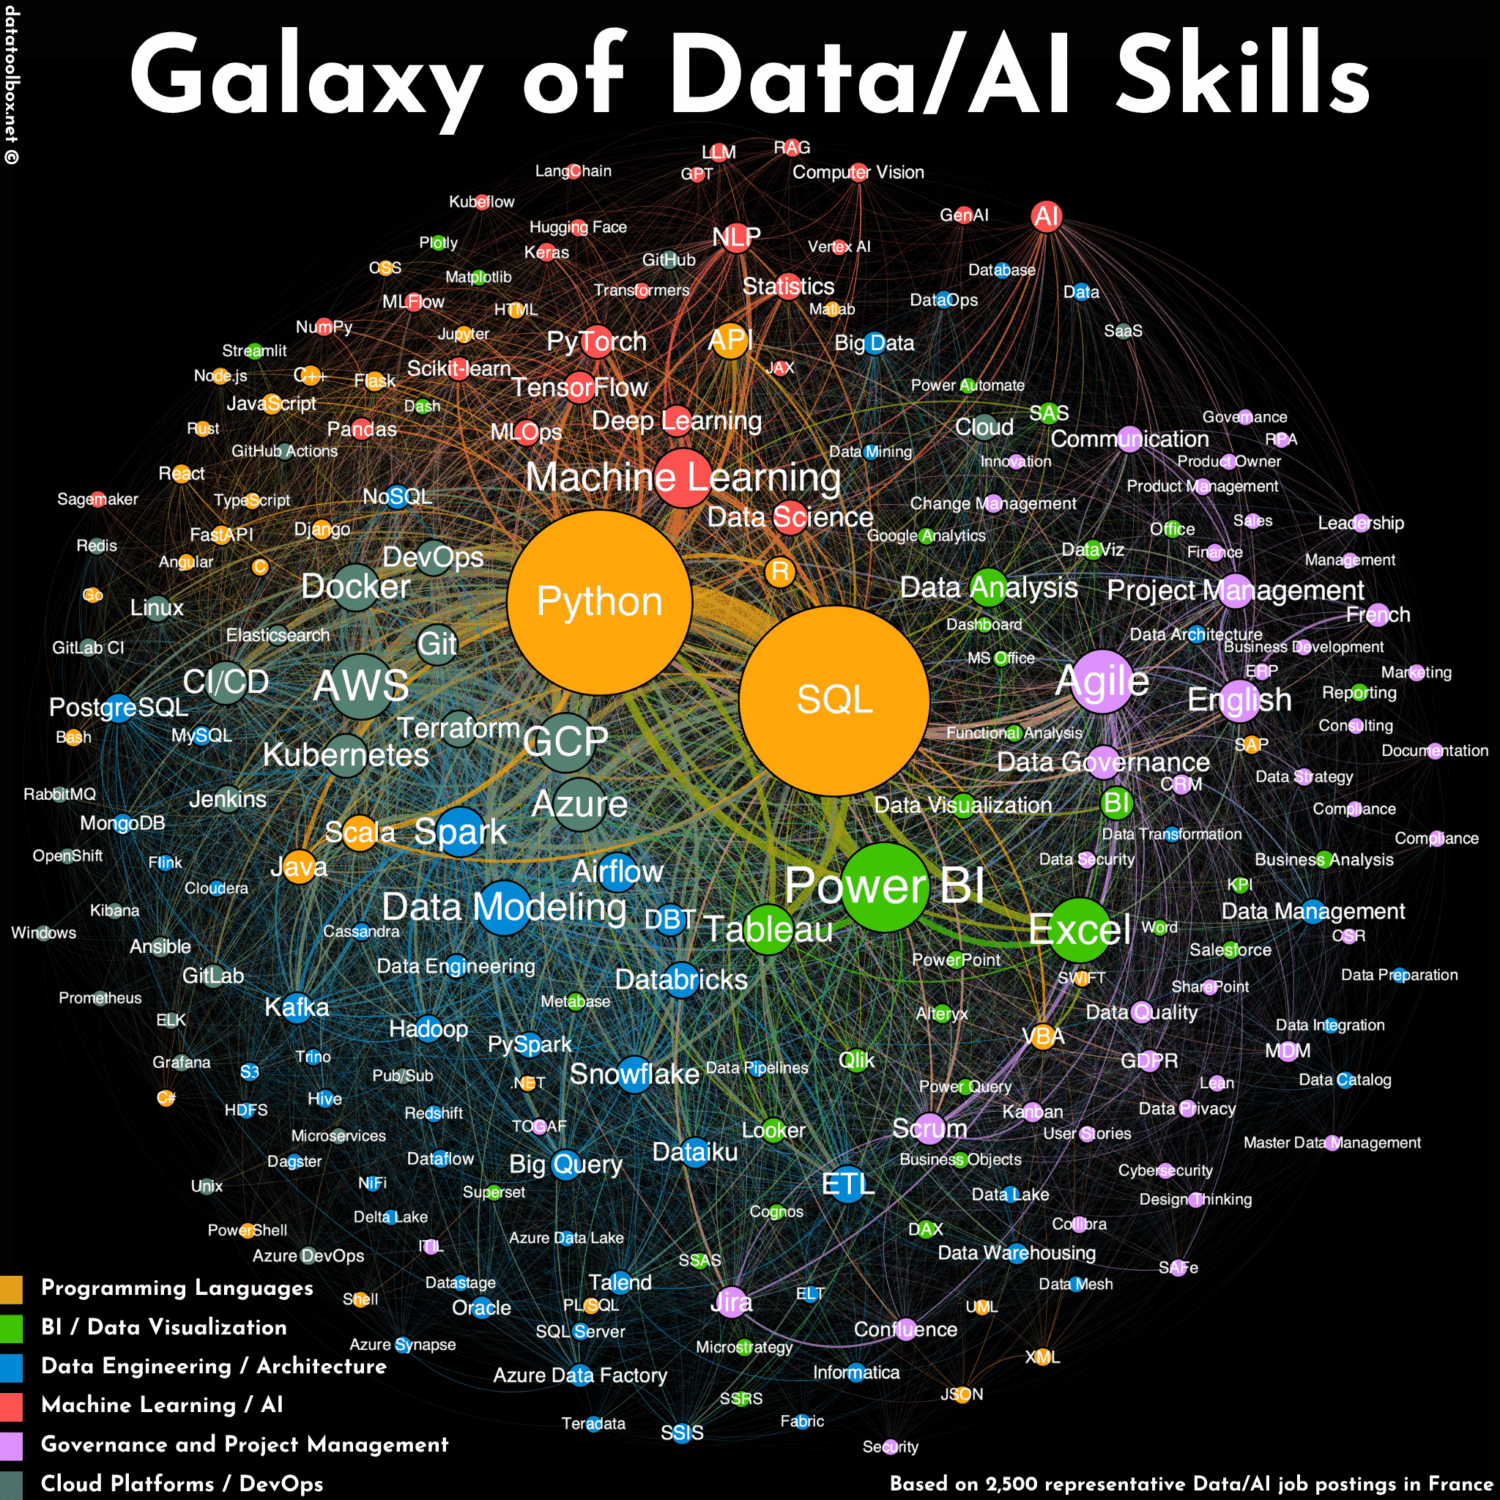
Once cleaned and structured, the data practically organized itself. Visualizing it as a skill galaxy revealed not just which tools and roles dominate the market, but how they connect and cluster in real-world job offers.
Each node represents a skill. The bigger the node, the more frequently it shows up in job postings. The thicker the links, the more often two skills appear together (think SQL & Power BI).
From this emerges a really coool structure with three main constellations:
- At the top, the Data Science zone, orbiting around the star that is Python.
- Bottom left, the Data Engineering universe, where a DevOps constellation cuts across the map.
- On the right, the Business Intelligence territory, lit up by a SQL supernova, gently fading into quieter yet essential areas like Governance and Product.
What started as raw text became a map of the Data & AI ecosystem ! Alive with connections, gravity, and meaning 🌌.
Coming soon !
Cool, okay, but how did you build that ?
You, petit (small) reader.
Give me a bit of time to put together a proper behind-the-scenes post, you’ll love it 💘. I’ll walk you through everything: from scraping to LLM prompts to graph generation. 👉 Stay tuned on the blog !
While you are here 💫

Why not explore more of the blog? You might enjoy these reader favorites 👇 :
- 📚 Home page
- 🧠 Data 101: A Beginner Guide to Data & AI: Understand how everyday actions generate data, and what it means for businesses.
- 💾 Data Format: From CSV to Delta and Beyond: Wondering how to share large datasets the smart way? This one’s for you.👤
- ⚔️ Analytical vs Transactional: Why You Can’t Mix Oil and Water: Learn why not all databases are created equal, and why that matters.
Copyright: You may reuse, repost, or repurpose the graphics for personal use. For professional or commercial use, please contact the site owner.