


Imagine this

“STOP! We’ve lost the water upstairs. The pipe burst.
Who designed this distribution network?” 💦
Suddenly, nobody cares about the new bathroom 🙃 ! The problem is somewhere behind the walls: a pipe is broken, water is no longer reaching the right place, and the entire building depends on figuring out where the flow stopped.
Your applications and tools continuously produce data. Your Data Warehouse and your other external services need that data somewhere, often in another format, at another frequency, and under very different constraints. In many architectures, this flow is also constrained by Master Data Management systems, which define which is the “official” version of key entities before they are propagated across the ecosystem.
Between all these systems sits an entire distribution network: data pipelines. And just like plumbing, the interesting questions are not tied to the brand of your pipe.
Why data needs to move ?
Before opening the pipe, there is a more fundamental question: why do we need pipes at all? The answer is simple, it’s because there is no God application 😁 !
More seriously, it’s because they is no single system that runs the whole company, stores every type of data and serves every type of workload well. Enterprise data is fragmented, sometimes deliberately, sometimes because organizations simply evolved that way.
Technical boundaries ⚙️
First and foremost, there are technical boundaries. Systems run on different infrastructure, clouds, networks and technology stacks. They are also optimized for different workloads. As we saw in Analytical vs Transactional: Why You Can’t Mix Oil and Water, operational systems (OLTP) are designed for many small, concurrent reads and writes on current state, while analytical systems (OLAP) are designed to scan, aggregate and analyze large volumes of historical data. Trying to make the same system do both creates conflicting design constraints !
Also, there is no universal database. In From Data Models to Database Technologies: Choosing the Right Tool for the Job, we already saw why relational, document, key value, wide column and analytical stores exist in the first place: different workloads lead to different storage models and technologies. And once we accept polyglot persistence, data movement becomes almost unavoidable.
Organizational boundaries 🏢
Enterprise systems are rarely designed by one team, at one moment, from one master plan.
Different business units have their own budgets, priorities and timelines. One country may standardize data on one platform while another uses something else. An acquisition can bring years of existing systems and data into the company overnight. You do not replace all of that just to make the architecture look prettier. We already saw in this article that MDM systems exist partly because key entities such as customers or products end up fragmented across organizational boundaries and have to be consolidated.
Purpose boundaries 🎯
Finally, there are purpose boundaries. A CRM knows your opportunities. Your ERP knows the invoices. Your website knows what customers clicked. Your support platform knows what went wrong. But none of them has the full picture.
And this is exactly why analytical systems exist. A traditional Data Warehouse brings those pieces together and keeps the history needed for analysis. Data Lake, Lakehouse, Fabric and Mesh showed how that same need led to different architectural approaches over time.
Anatomy of a data pipeline

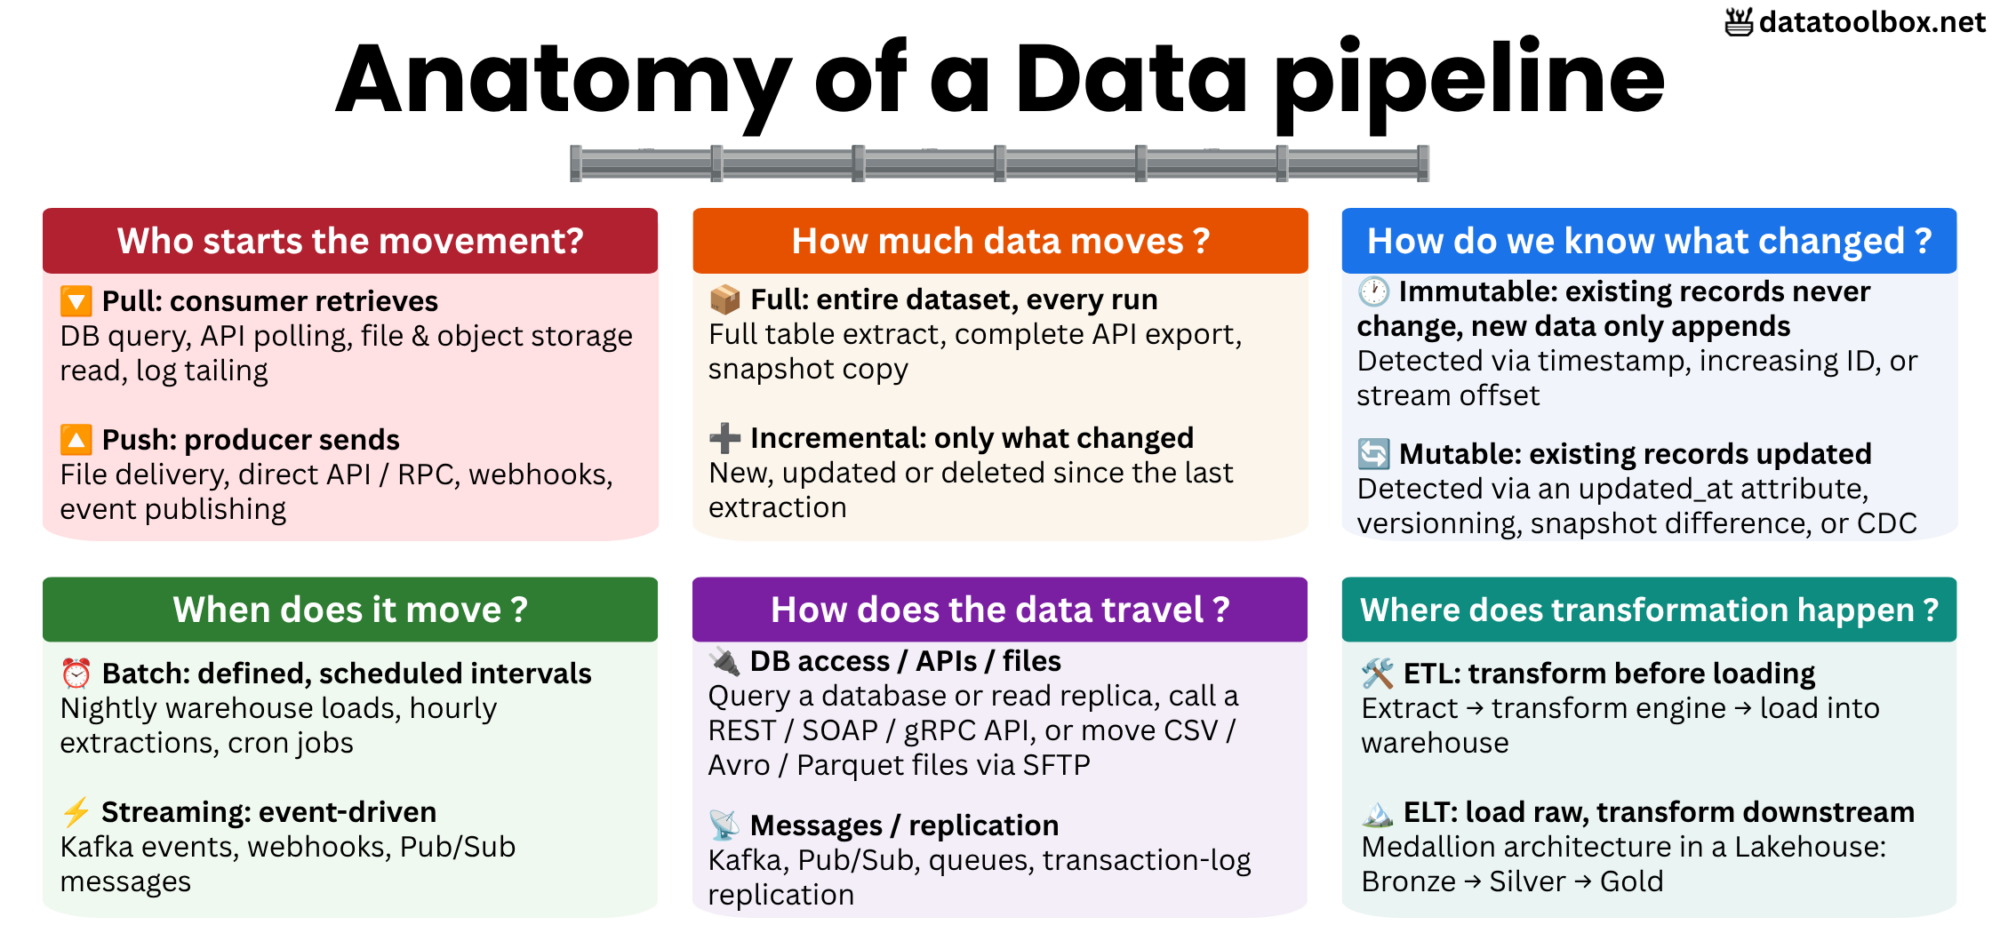
Let’s look at the bigger picture. The goal of this section is to step back and build a broader and composite view of data pipelines, independent of the tools we use or the organizations we work in.
The idea is to stay truly tool agnostic. Before discussing implementation details, we need to understand the fundamental questions that every data pipeline has to answer. We’ll structure this around 6 key questions that, together, will form the foundation of our META MAP. We’ll build it progressively, one question at a time ✊.
1️⃣ Who starts the movement?
Data does not move by itself: one side has to initiate the exchange. Either the destination goes to the source to retrieve data, or the source sends data outward when it becomes available. This gives us the first fundamental distinction: Pull vs Push.
🔹 PULL: the consumer initiates
The receiving side actively retrieves data from the source, here are the typical patterns:
- Database query: the consumer connects to a database (or it read replica) and retrieves its records.
- API request / polling: the consumer calls an API exposed by the source to retrieve data. The API can use REST, GraphQL, SOAP, gRPC or another interface technology.
- File and object storage reads: the consumer looks for and reads files from S3, Azure Blob Storage, SFTP or a filesystem.
- Log tailing: the consumer continuously reads new entries appended to a log file.
🔹 PUSH: the producer initiates
The producing side actively sends data toward another system, here are the typical patterns:
- File delivery: the source deposits a file into S3, SFTP or another landing zone.
- Direct API / RPC delivery: the source calls an interface exposed by the receiving system to send data or trigger an operation. This can also use REST, SOAP, gRPC or another interface technology.
- Webhooks: the source sends an HTTP request when something happens.
- Event or message publishing: the source publishes records to Kafka, a queue or a publish subscribe system.
🌎 And in real-life, how do I choose ?
In practice, the source often decides for you first ! If it exposes only a DB/API, you use pull. If it provides webhooks or publishes events, you use push. And when both are possible:
- Prefer Pull when you want control: you decide when to extract, how much to request, how to retry, and how much pressure to put on the source. This also makes replay and recovery easier because the consumer can usually request the data again.
- Prefer Push when latency matters: the producer sends changes as they happen, avoiding repeated and wasteful polling. But reliable delivery then becomes part of the architecture: events need to survive temporary consumer failures.
2️⃣ How much data moves?
Once the connection exists, the next choice is how much data to transfer each time: everything, or only what changed.
🔹 FULL: Move everything
A Full load transfers the entire dataset again, regardless of what changed since the previous run. This can mean a full table extract, a complete API export, a full file replacement or a snapshot copy.
🔹 INCREMENTAL: Move only what changed
An Incremental load transfers only new, updated or deleted data since the previous extraction. It avoids repeatedly moving unchanged data, but introduces a new problem: how do we know what changed? We will answer that next.
🌎 And in real-life, how do I choose ?
The choice depends first on how the source data behaves:
- For immutable and append only data such as transactions, invoices or events, Incremental loading is the natural pattern: existing records do not change, so the pipeline only needs to ingest what was added since the last run.
- For mutable entities such as customers, products or accounts, the problem is different because existing records can be updated. If the dataset is manageable, reloading the current state or taking periodic snapshots can be the simplest and most robust approach.
- When mutable data becomes too large or too frequent to reload efficiently, we switch to Incremental loading and explicitly track changes through timestamps, versions or source change feeds (like CDC, defined later).
3️⃣ How do we know what changed?
If we choose an Incremental load, we now need a reliable way to identify what is new, updated or deleted. The first thing to look at is how the source data behaves.
🔹 Immutable data: the change is the new record
With immutable data, existing records are never modified. New information is appended as new rows or events. Typical examples are transactions, event logs or sensor readings.
In that case, detecting change is relatively simple: the pipeline only needs to identify records that appeared after the last successful ingestion. The common mechanisms include:
- Creation timestamp: ingest records where
created_at > last_ingestion. - Increasing ID or sequence: ingest records with an identifier greater than the last processed value.
- Offset or position: resume from the last consumed position in a log or event stream.
🔹 Mutable data: we need to detect state changes
With mutable data, existing rows can be updated in place. A customer changes address, a product changes category, an order changes status. If we simply read new rows, we miss those changes. The common mechanisms include:
- Updated timestamp: the source maintains an
updated_atfield and the pipeline retrieves records modified since its previous run. - Version or sequence number: each update increases a version that can be used as a watermark.
- Snapshot comparison: compare two states of the dataset to identify inserts, updates and deletions.
- Audit or history tables: read a separate table where the application records its changes.
- Change Data Capture (CDC): capture
INSERT,UPDATEandDELETEoperations, often directly from the database transaction log.
🌎 And in real-life, how do I choose ?
The right mechanism depends first on how your source data changes: immutable, mutable, append only, versioned, etc. We covered that decision in detail in Data Modeling: Types of Data and Their Change Behavior.
4️⃣ When does the movement happen?
The main distinction is between scheduled processing and event-driven processing.
🔹 Batch (Scheduled)
With Batch, data is processed at defined intervals: every night, every hour, every period that you define… Typical examples are nightly Data Warehouse loads, hourly API extractions or periodic file ingestion.
🔹 Streaming (Event-driven)
With Streaming, work starts when new data or events arrive, such as Kafka events, webhooks, Pub/Sub messages, logs, etc. This is often associated with event based solutions, where consumers stay active and process data as it arrives.
🌎 And in real-life, how do I choose ?
Start with the freshness requirement. Use Batch when minutes, hours or days of latency are acceptable and use Streaming when data must propagate quickly as events arrive.
5️⃣ How does the data travel?
Once data is ready to move, it still needs a channel between source and destination. Most pipelines rely on a few recurring mechanisms:
- Database access: the pipeline connects directly to a database or it read replicas (to avoid overloading the primary node used for writes).
- APIs: the source exposes data through a controlled interface, using mechanisms such as REST, SOAP, gRPC, or webhooks.
- Files: data is exchanged as CSV, JSON, Avro, Parquet or other files through SFTP, object storage or landing zones. Unfortunately, this is still common for bulk exchanges, legacy systems, and integrations between organizations.
- Messages / Event streams: data travels as discrete messages or events through Kafka, Pub/Sub or queues. Producers and consumers are decoupled, which makes this pattern well suited to asynchronous and event-driven architectures.
- Database replication: data is copied from one database to another to maintain a synchronized replica or provide low-latency access elsewhere. Under the hood, replication is often powered by CDC reading the transaction log.”
🌎 And in real-life, how do I choose ?
As always, the source often chooses for you: SaaS applications usually expose APIs, legacy exchanges often rely on files, databases may allow direct reads or replication, and event based applications naturally publish to brokers.
6️⃣ Where does transformation happen?
Moving data from one system to another is only part of a pipeline. Data often needs to be adapted before it can be reused: formats may differ, identifiers may not align, duplicates may exist, and business concepts such as revenue or active_customer may need consistent definitions.
This is the role of transformation: cleaning records, standardizing formats and codes, aligning identifiers, joining datasets, enriching data, applying business rules, or reshaping structures for a specific use case.
A key architectural question is therefore: does transformation happen before or after data is loaded into the target data platform? This is the main distinction between ETL and ELT.
🔹 ETL: Transform before loading
ETL stands for Extract, Transform, Load. Data is extracted from a source system, transformed outside the target analytical platform, then loaded into that platform in the structure expected by downstream users.
A simplified flow looks like: Extract from Source system → Transform via your ETL engine → Load into Target platform.
This pattern was common in traditional Data Warehousing architectures, where transformation engines prepared data before loading it into warehouse tables. A staging area may still exist between extraction and transformation. This does not change the pattern as long as the main analytical transformations happen before the data is loaded into the target platform.
🔹 ELT: Load first and transform downstream
ELT stands for Extract, Load, Transform. Data is extracted from a source system and first loaded into the target platform, often in raw or lightly processed form.
A simplified flow looks like: Extract from Source system → Load into Target platform -> Transform in your Target platform.
The main advantage is that the original data can be retained and reused to produce multiple downstream datasets without having to extract it again. A common example is the Medallion architecture used in Data Lakehouse platforms, where data is progressively transformed through multiple layers: Bronze for raw loaded data, Silver for cleaned and structured data, and Gold for business ready datasets. For a deeper breakdown, see the dedicated article.
🌎 And in real life, how do I choose?
The choice depends mainly on where transformations are best executed, not on whether the target is a Data Warehouse, Data Lake, or Lakehouse:
- ETL transforms data before loading, typically when the target has limited processing capabilities or when governance and security require upstream preparation. This was the dominant pattern in traditional Data Warehouses.
- ELT loads data first and transforms it inside the target platform. This makes it possible to retain historical raw data, replay transformations, and create multiple downstream datasets without re-extracting the source data. It is therefore common in modern cloud Lakehouses, which provide scalable storage and compute.
💡 Putting it all together: what does a real pipeline look like?
And you know I like infographics, so here are my two cents 😉 !
Yassine
Now let’s put all these decisions together with two concrete examples, from a traditional enterprise stack to a modern cloud-native architecture.
🔹 Example 1, the 2000s enterprise Data Warehouse
Imagine a large bank running its core business on an ERP, a CRM, and several relational databases. The objective is to consolidate this data into a central Data Warehouse for reporting.
1- Sources: Oracle ERP for finance and operations, CRM for customer data, DB2 / Oracle databases for core applications, CSV files from external systems
2- Extraction: Database queries, connectors, file exports
3- Frequency: Batch, typically nightly
4- Movement: Enterprise ETL tool such as Informatica PowerCenter
5- Destination: On-premise Data Warehouse, for example Oracle or Teradata
6- Transformation: ETL, data is cleaned, joined, standardized, and mapped to the warehouse model before loading
🔹 Example 2, the 2020s cloud data platform
Now imagine a cloud-native company combining operational systems, SaaS applications, and event data for analytics, machine learning, and reporting.
1- Sources: PostgreSQL for core application/ERP data, Salesforce for CRM, Stripe for payments, application events for user behavior
2- Extraction: CDC for PostgreSQL, APIs for SaaS tools, event streaming for applications
3- Frequency: Near real-time for CDC and scheduled for APIs
4- Movement: Fivetran or Airbyte for ingestion, Kafka for streaming
5- Destination: Cloud Warehouse/Lakehouse (Snowflake, BigQuery, Databricks)
6- Transformation: Mostly ELT, executed inside the platform using SQL, dbt, Spark, or similar tools
⚠️ Two close cousins: Reverse ETL and Data Virtualization
To be exhaustive, we need to know that not every data flow fits neatly into the ETL / ELT model.
- Reverse ETL moves data in the opposite direction: transformed data from the analytical platform is pushed back into operational tools such as Salesforce or HubSpot. For example, a customer segment calculated in the warehouse can be synchronized back into the CRM for sales or marketing teams.
- Data Virtualization / Federation takes a different approach altogether: instead of physically moving data into a central platform, queries access multiple source systems directly and combine their data at query time. This pattern can notably appear within broader Data Fabric architectures.
When the pipe bursts

A pipeline can fail for obvious technical reasons: a network change, an expired credential, a broken connector, or an ETL job that crashes. But from experience, the most failures come from “people”: upstream systems change, and downstream teams are not aware of it.
Each application has its own Product Owner, developers, backlog, releases, and priorities. Meanwhile, the Data Factory or analytics teams consuming its data may sit in a completely different organization, sometimes even outside the company. And that is where things get complicated.
🔹 When upstream changes break downstream
Imagine your pipeline depends on an API, database table, Kafka event, or MongoDB collection.
The producing team changes something: an API field is renamed, a column changes type, a table disappears, a new status value appears, an API moves from v1 to v2, or a document gets a new structure.
From the application team’s perspective, this may be a perfectly valid change. But downstream, it can break several pipelines, dashboards, or ML models.
🔹 What is a Data Contract?
A Data Contract is an explicit agreement between a data producer and its consumers about the data being exchanged. It defines what downstream systems are allowed to rely on: the schema, the meaning of the values, how fresh it will be, and what happens the day the producer wants to break it.
For example, a contract may specify that: customer_status must be a non-null string with the values prospect, active, or inactive. Renaming the field or changing these values would therefore be considered a breaking change.
The producer can still evolve its application, but changes to the data interface must follow agreed rules: preserve backward compatibility, version breaking changes while keeping the previous version temporarily, or give consumers time to migrate properly.
The plumber’s toolbox
All four do the same job. What separates them is how much infrastructure you still have to babysit 🍼.
1️⃣ Scripts + cron
The most direct approach is to write the pipeline yourself and run it on a machine.
- Tools: Python, Bash, SQL, cron.
- Compute: runs on the machine executing the script.
- Strength: no license, no lock-in, and you can read and understand every line.
- Limits: scaling is limited by the machine. Try moving 50 TB on a 2 vCPU / 8 GB RAM VM 🙃. You also need to manage retries, dependencies, logging, secrets, monitoring, etc.
2️⃣ Visual ETL suites
Traditional ETL suites bring pipeline development and operations into a single graphical platform.
- Tools: Informatica PowerCenter, Talend, SSIS.
- Compute: an ETL engine runs on dedicated servers/VMs and performs the transformations.
- Strength: All transformations, pipelines, scheduling, retries, logging and monitoring are managed in one platform.
- Limits: Those platforms are typically commercial and proprietary, infrastructure still needs to be sized and operated, and the platform can become heavy and less flexible than code based approaches.
3️⃣ Cloud integration platforms
Cloud integration platforms keep the same idea, but move more of the infrastructure management to the cloud provider.
- Tools: Azure Data Factory, AWS Glue, Google Cloud Data Fusion.
- Compute: You do almost nothing besides (+) Create a cluster in the UI. The cloud provider takes care of provisioning and managing the underlying workers, clusters and integration runtimes.
- Strength: Much less infrastructure to operate, easier scaling, and native integration with cloud storage, IAM, secrets and analytics services.
- Limits: The execution engine still exists behind the scenes, costs can grow with usage, and you become more dependent on the cloud provider’s ecosystem and abstractions.
4️⃣ Modern modular stacks
Modern stacks split the responsibilities of a traditional ETL platform across several specialized tools.
- Tools: Airflow, Dagster or Prefect orchestrate the pipelines, Fivetran and Airbyte ingest the data, dbt handles transformations, Spark or Flink process large workloads, and Kafka handles event streaming.
- Compute: It’s a zoo, you have a lot of choices! Airbyte can run ingestion jobs on its own workers, dbt executes transformations directly in your Data Warehouse/Lakehouse, Spark runs jobs on distributed computes, while orchestration tools like Airflow mostly coordinates them all .
- Strength: You can choose the best tool for each job and not relying into “I-do-all” proprietary platform.
- Limits: More flexibility also means more moving parts to connect, configure, monitor and operate.
Conclusion

Data pipelines can look complex because the tools, architectures and patterns keep changing. But underneath, the objective stays simple: move data reliably from where it is produced to where it is needed.
The hard part is rarely moving the data itself. It is choosing the right trade-offs, keeping the flow maintainable, and making sure changes upstream do not silently break everything downstream.
👉 Next step: if you want to see how the key entities flowing through these pipelines are structured and governed, continue with Masterclass Data Modeling: How Data Changes Drive Schema Design.