

Introduction

Imagine this. You are a pilot in a small ultralight plane. Clear skies, calm weather, everything is simple. You can rely on instinct, you can see the runway ahead, and you line up perfectly just by sight 👀.
✈️ But the story changes when you move to a big jumbo jet. It is night, the sky is turbulent, the ceiling is low, and you have hundreds of passengers onboard. Flying without instruments is no longer an adventure, it is a gamble.
That is what happens in business. As scale, complexity, and speed increase, you cannot just rely on gut feeling anymore. You need Data. And Data is not just the dashboard. Data is the entire cockpit. It’s the altitude indicator, the airspeed, the engines’ thrust, the trajectory, the weather radar.
That’s why data has to be strategic — it’s what helps you understand your environment, your customers, your suppliers, and your revenue, so you can adjust course before you hit the ground 💥.
Data as an Organizational Capability
An organizational capability is a function a company can consistently perform well, at scale, across teams, and over time. It’s not about individual talent or one-off successes, but the combination of people, systems, processes, and culture that make something repeatable and reliable.
Data should be treated no differently. Owning a data lake or deploying a dashboard does not mean a company has a data capability. That only happens when data can be used consistently to support decisions, automate processes, and generate insight across the business, without friction or reinvention.
This requires trusted data, shared definitions, clear ownership, scalable systems, and teams who know how to work with data in practice. Without that, data remains fragmented, underused, and difficult to operationalize, no matter how advanced the tooling may appear.
Strategic Data Value Equation
In practice, very few organizations actually generate real value from their data. It’s rarely a matter of volume or tooling. The real difference comes from how two opposing forces play out inside the company — something we’re going to theorize today to better understand why so many businesses struggle to make data work.

One of these forces creates friction and blocks flow. The other unlocks alignment and enables value creation. The balance between them determines whether your data becomes a strategic asset or stays a cost center.
Blocking Forces
These are the factors that slow down, fragment, or block the ability to use data effectively. They often accumulate over time and affect both the technical and organizational layers.
- Organizational silos: Data is produced and managed by isolated teams with no shared standards, leading to duplication, inconsistency, and conflicting KPIs.
- Mergers and acquisitions: Each M&A event adds complexity, with overlapping systems and incompatible data models that are rarely reconciled properly.
- Legacy systems and technical debt: When core systems are outdated or poorly integrated, extracting and using data becomes costly and unreliable.
- Vendor and platform lock-in: When data is scattered across third-party SaaS tools or cloud platforms without interoperability, it becomes harder to centralize and reuse.
- Regulatory complexity: Compliance requirements (e.g., GDPR, NIS2, sector-specific laws) can introduce friction, especially when governance is reactive or unclear.
Enabling Forces
These are the forces that bring structure, consistency, and value orientation to the data function. They require long-term investment, collaboration across functions, and leadership support.
- Strong data and AI teams: These teams develop reusable assets, standardize definitions, and work closely with the business to deliver impact-driven use cases.
- Modern, interoperable IT architecture: A scalable infrastructure ensures that data can be collected, transformed, and consumed efficiently across systems.
- Operational governance: Clear ownership, consistent rules, and embedded compliance frameworks create trust and reduce friction in how data is used.
- Collaboration between business and tech: Data becomes valuable when it is aligned with operational reality and strategic goals, not just produced for reporting.
- Shared language and culture: When business, IT, and data teams speak the same language and share common KPIs, the path to value becomes significantly shorter.
The Equation
Strategic Data Value = Enabling Forces – Blocking Forces
The equation is straightforward. When blocking forces dominate, data becomes noise: reports contradict each other and data/AI projects stall. But when enabling forces gain the upper hand, data flows with purpose, supports decisions, and drives measurable business outcomes.
When Things Go Right — and When They Don’t
In companies, when the Strategic Data Value Equation > 0, you don’t spend 20 minutes trying to find a client across five CRMs. You don’t extract a CSV from one tool just to re-import it into another. You don’t ask your team to “rebuild the same report” every month because no one trusts the previous one.
You see it in startups with no legacy. In companies built 100% in the cloud. In those who took their data stack seriously early on. The flow is smoother, the context is shared, and people can actually focus on doing their job instead of stitching systems together. According to a McKinsey study, organizations that are data-mature are 23x more likely to acquire customers, 6x more likely to retain them, and 19x more likely to be profitable (McKinsey).
And then there’s the other side when the Strategic Data Value Equation < 0: The big enterprise built on ten mergers, with 20 CRMs and 30 ERPs, none of which talk to each other. Data gets passed around in Excel, dashboards are rebuilt from scratch in each department, and no one is quite sure which number is the right one.
Attention: This never ends!

I’ve got good news and bad news for you!
The good news? You’re not alone. Every organization struggles with alignment between data, systems, and teams. Even the best ones. It’s normal, and it’s fixable.
The bad news? It never really ends. There is no point in time where someone will say, “Our data and IT are perfectly aligned. Let’s move on!”.
That moment does not exist, and never will. Why? Because every day, something changes:
- 🧩 New tools get added, old systems are decommissioned.
- ☁️ Some apps move to the cloud, legacy platforms eventually disappear.
- 📈 Data flows evolve, break, or multiply.
- 📜 New regulations land.
- 🏢 M&A adds new complexity: entities are sold, others are integrated, and nothing fits cleanly.
The 3 corners: Technical, Product, Strategic
Also, something important that I want you to know: when it comes to data (and frankly most other subjects), there is never just one lens. Looking at a problem only through the technical side, or only through the business side, is like trying to fly with one wing.
A better way to think about it is as a triangle. Three corners, three perspectives: Technical, Product, Strategic. If you stay stuck in one corner, you lose balance:
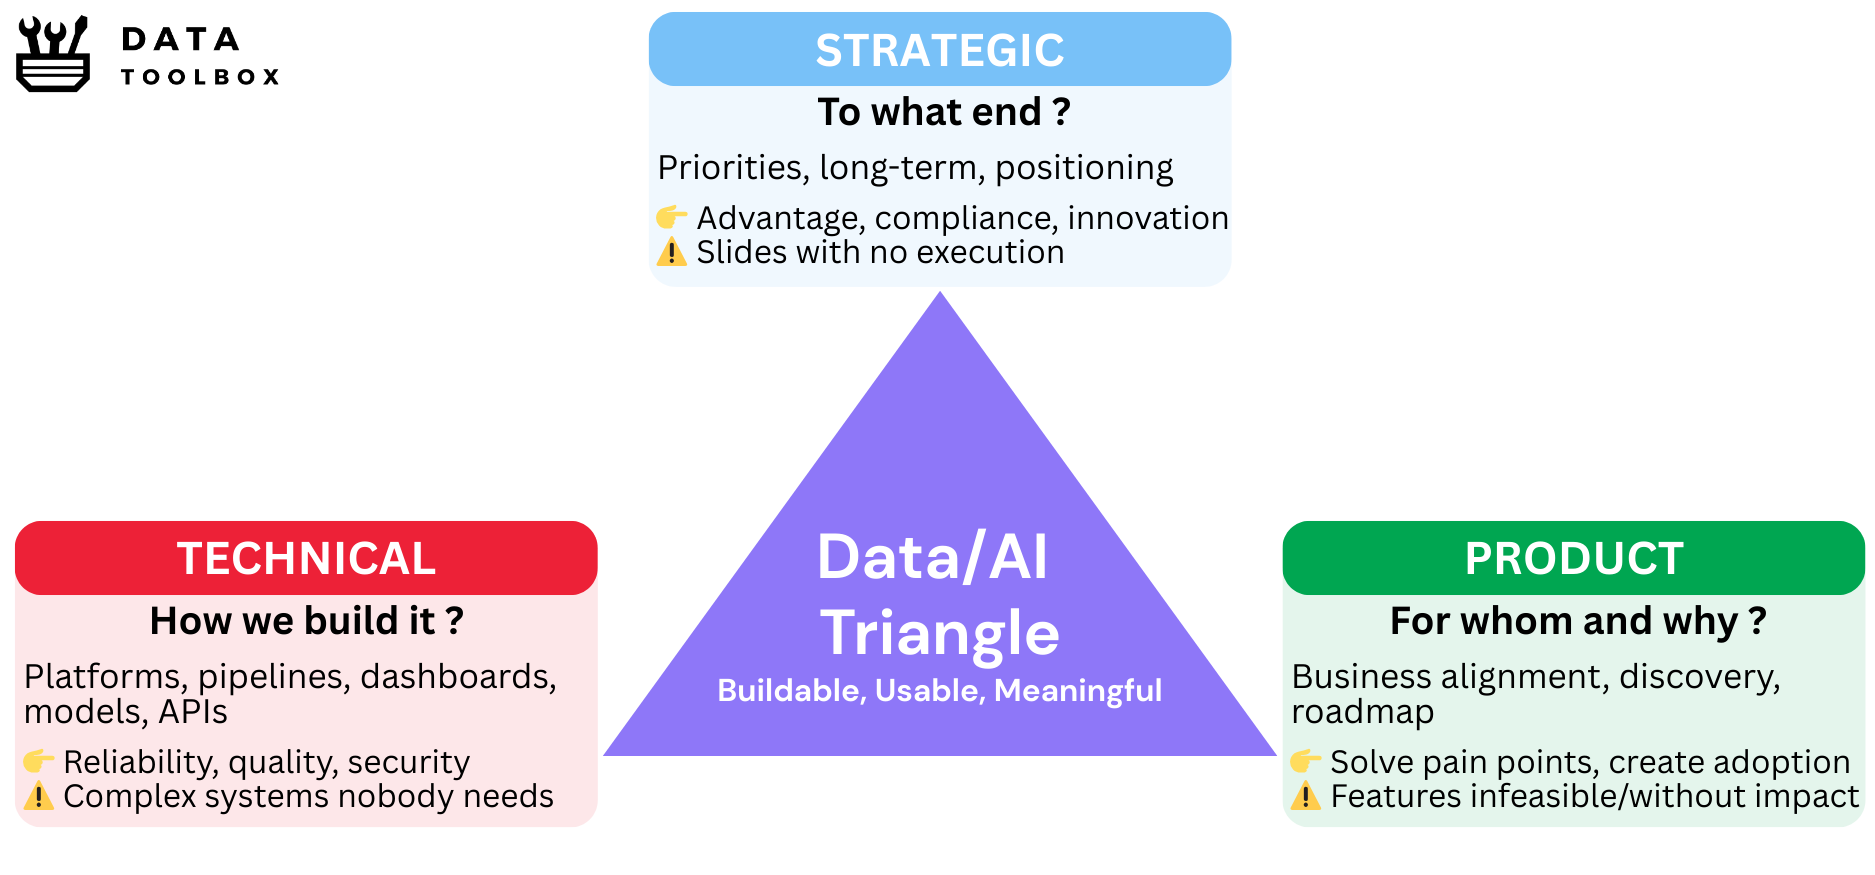
1️⃣ Technical — How we build it ? This is the engineering side, the craft. Dashboards, pipelines, machine learning models, APIs. The “how” of data. Without it, nothing runs.
But when you stop here, you end up with plumbing projects: elegant, complex, and rarely used.
2️⃣ Product — For whom and why ? This is the user side. The alignment with business, the discovery, the roadmap. Who are we building for, and what pain are we solving?
Do we consolidate fragmented systems so finance closes faster? Do we simplify workflows so sales can focus on customers?
3️⃣ Strategic — To what end ? This is the north star. Why does this matter for the company as a whole? Are we building yet another MDM on top of decades of legacy — just patching with tape — or is the real move to have the courage to consolidate the organization itself? Are we adding one more dashboard that might be read once but will never drive real impact? Is the goal compliance, efficiency, or innovation?
Conclusion

Welcome aboard your AirData 777 !
Here’s what a real, data-driven organization looks like when it’s built to fly:
- 🧭 The cockpit = your business and product decision-makers
- 📊 The instruments = your BI tools and analytics platforms
- ⚙️ The wiring and sensors = your data engineering and governance systems
- 👨✈️ The crew = your IT, Data, and Governance teams
- 🤖 The autopilot = your AI & ML systems
So yes, data is strategic. It’s not just your rear-view mirror. It’s your cockpit, your instruments, your systems, and your ability to change direction before it’s too late.
👉 If you want to dive deeper into what are Data & AI products, start here: What Are Data and AI Products in the Real World?